Detecting Deforestation: A Machine Learning Approach Using Satellite Data
Written on
Chapter 1: Introduction to Deforestation Detection
Detecting deforestation through satellite imagery is a pressing concern for environmentalists. As part of my Capstone Project for Udacity’s Machine Learning Engineer Nanodegree, I aimed to tackle this issue by implementing machine learning techniques. My passion for environmental conservation led me to explore a Kaggle competition focused on classifying satellite images of the Amazon rainforest. This competition, detailed in the fast.ai course, sparked my journey into identifying deforestation and climbing the Kaggle leaderboard.
Background
The Amazon rainforest is the largest tropical rainforest globally, encompassing about 2.1 million square miles. It houses an estimated 390 billion trees across 16,000 species, earning it the nickname “lungs of the planet” for its vital role in regulating the Earth's climate and producing roughly 20% of the world’s oxygen. However, since 1978, over 289,000 square miles have been lost across countries such as Brazil, Peru, and Colombia. This alarming rate of deforestation, equivalent to losing 48 football fields every minute, poses a significant threat to biodiversity and contributes to global warming by releasing stored carbon. Enhanced data on deforestation and human encroachment can empower governments and local stakeholders to respond more effectively.

Problem Statement
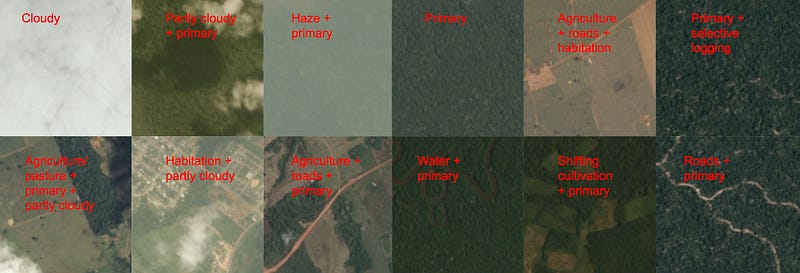
The primary objective of my project is to monitor changes in the Amazon rainforest resulting from deforestation through satellite imagery. The dataset provided by Planet, hosted on Kaggle during the "Planet: Understanding the Amazon from Space" competition, includes labels developed with Planet’s Impact team. The challenge involves multi-label image classification, where each image can possess one or multiple atmospheric labels along with various common and rare labels.

Evaluation Metrics
Models are assessed based on their mean F2 score, a metric frequently used in information retrieval that considers both precision and recall. Precision calculates the ratio of true positives to all predicted positives, while recall measures true positives against all actual positives. The F2 score is defined mathematically as:

Implementation
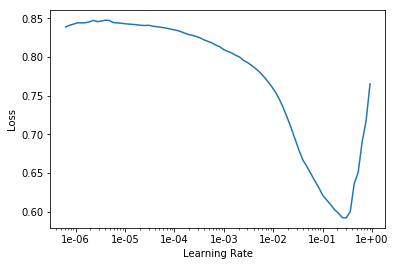
For my analysis, I utilized deep learning models via the fastai library, known for streamlining neural network training. A key feature of fastai is its use of cyclical learning rates, which enhance classification accuracy and reduce the need for numerous iterations. Instead of gradually decreasing the learning rate, this technique allows it to vary cyclically within set boundaries. Transfer learning is also simplified with fastai. The following code snippet demonstrates how I set up a learner with a pre-trained model:
from fastai.vision import *
learn = cnn_learner(data, models.resnet50)
My final solution comprises an ensemble of five pre-trained models on ImageNet: resnet50, resnet101, resnet152, densenet121, and densenet169. I fine-tuned each model separately, dividing the data into 80% for training and 20% for validation. By employing progressive resizing—training on smaller images first and gradually increasing their size—I was able to optimize performance.

Refinement
To establish a baseline score for future comparison, I implemented a resnet50 model without progressive resizing, using 256x256 pixel images and achieved an F2 score of 0.92746. Through progressive refinement and test-time augmentation, I improved my score to 0.93041.

Results
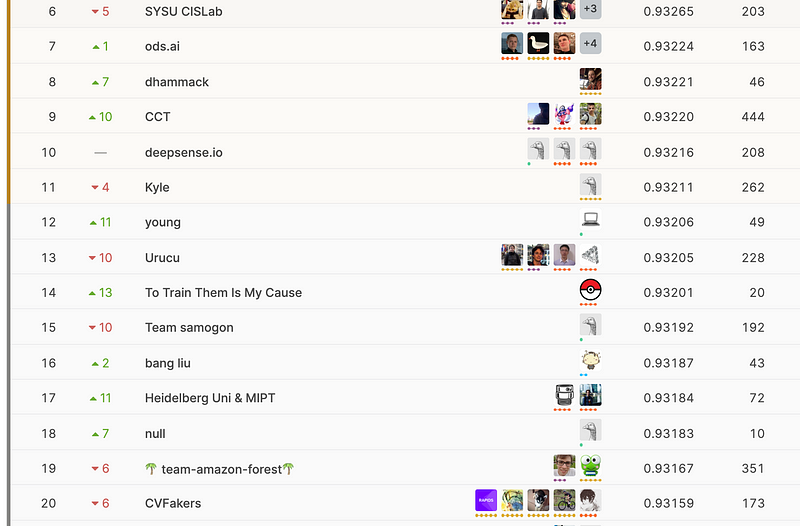
Following the same strategy with the other models, I built an ensemble that attained an F2 score of 0.93173 on the private leaderboard, placing me 19th among 938 competitors.


Reflection and Future Improvements
One technique I wish I could have employed is Single Image Haze Removal, which could have significantly improved the classification of images affected by haze. Although I implemented the algorithm, processing the entire dataset was time-consuming. In future work, I aim to refine this process and explore k-fold cross-validation to enhance model training.
Moreover, I plan to experiment with additional models and architectures to increase ensemble effectiveness, as noted by the competition's top contenders.
Overall, I am pleased with my outcomes, achieving a position in the top 2% on the leaderboard. My ambition is to break into the top 10 or even surpass the first-place finisher by applying the improvements outlined above.

You can access the complete code to replicate my findings on my GitHub.
Chapter 2: Exploring Additional Resources
This video delves into utilizing satellite imagery to investigate deforestation on the Global Forest Watch platform, providing a practical overview of current methodologies.
In this video, high-resolution satellite imagery is examined for its role in uncovering deforestation patterns, showcasing the importance of advanced technology in environmental monitoring.