The Fascinating World of Physics Gadgets: A Tribute to Innovators
Written on
Chapter 1: The Marvel of the Smith Chart
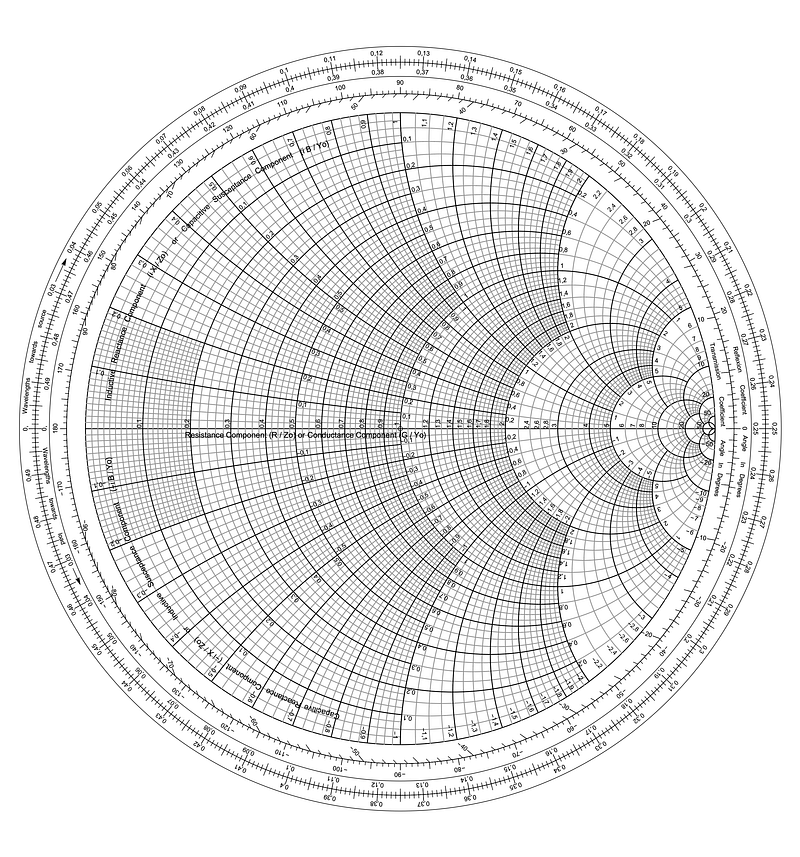
The captivating realm of conformal geometry is exemplified beautifully through the Smith Chart. This innovative tool visualizes the complex Möbius transformation, which is instrumental in analyzing delays in radio, microwave, and high-speed networks.

The Smith Chart's design, featuring mutually orthogonal circles, resonates with the decorative patterns seen in cobblestone streets across many European cities, including my native Berlin. This exploration is dedicated to Dr. Don Hewitt, whose wisdom has profoundly shaped my understanding of this subject.
Interestingly, the title I've chosen is inspired by Roald Dahl's beloved "The Fantastic Mr. Fox," a tale that has enchanted my family for years. The charm of Dahl's narrative parallels the intrigue of the Smith Chart, a tool that, despite the passing of time, remains relevant in today's microwave engineering and ultra-high-speed networking fields.
Among the gadgets that have fascinated me, many have unfortunately become obsolete, such as the slide rule and early computers, which were already relics by the time my scientific career began 45 years ago.
Chapter 2: The Enduring Legacy of the Smith Chart
In the present day, the Smith Chart is still in use, recognized as the primary graphical display for scattering parameters—crucial for understanding how these parameters change with distance or wavelength due to phase delays. This concept, where waves interact with inhomogeneities in their medium, is foundational in electromagnetic wave studies.
Historically, early explorations of S-Matrix concepts and Feynman diagrams in particle physics share a rich interconnection with the development of the Smith Chart. Physicists like Robert Dicke contributed to its conceptual groundwork during World War II, emphasizing the chart's importance in both practical and theoretical frameworks.
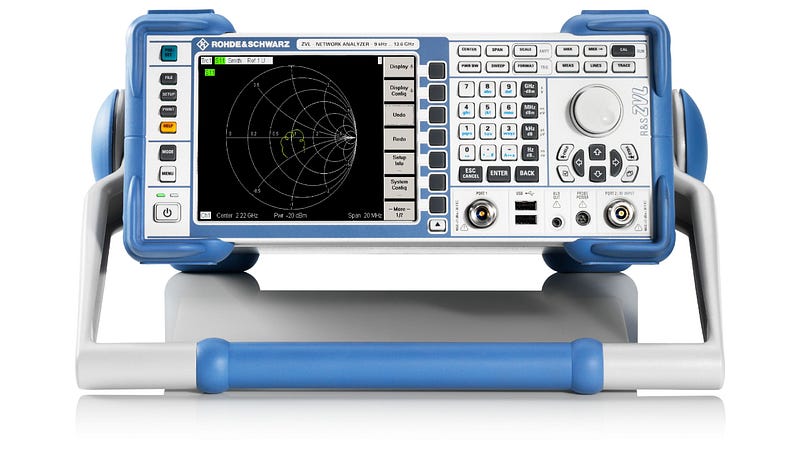
The Smith Chart serves as a vital tool in modern network analyzers, enabling engineers to diagnose issues in microwave and radio networks by visually representing frequency response curves of scattering parameters.

The chart, named after its co-developer Philip Hagar Smith, emerged around 1939, although similar concepts were independently proposed by Japanese mathematician T?saku Mizuhashi and Russian engineer Amiel R. Volpert. The idea of visualizing scattering phenomena was prevalent among engineers even before the formalization of the Smith Chart.
Understanding the Smith Chart's structure reveals its elegant design: two families of circles that intersect at right angles, a characteristic that follows from the properties of complex analytic functions.
Chapter 3: Practical Applications of the Smith Chart
The Smith Chart's primary function is to translate termination or disruption impedance into scattering parameters, specifically reflection coefficients. This transformation is critical in high-speed networks, where the intricate relationship between impedance and reflections can lead to significant data transmission issues due to delays from the finite speed of light.
An impedance can be conceptualized as a cause, while the resulting reflections are the effects of those disruptions. The relationship between the two is elegantly captured through Möbius transformations, a mathematical framework that underlies the Smith Chart's utility.
This fascinating tool has applications that extend into the realm of Special Relativity, where it can be used to graphically calculate Lorentz transformations. The mathematical elegance of the Möbius transformations is not only a testament to their beauty but also to their practical applications in understanding complex phenomena.
Chapter 4: Historical Perspectives and Future Directions
The Smith Chart's legacy is rich, with contributions from various innovators, including Philip Hagar Smith, Amiel R. Volpert, and T?saku Mizuhashi, each playing a vital role in its development. Their efforts reflect a deep understanding of Möbius transformations and their significance in engineering.
As we navigate the future of technology and science, the Smith Chart remains a vital tool in our arsenal, bridging the gap between theoretical physics and practical engineering applications.
